

At Tracebit, we monitor billions of events in AWS every week using CloudTrail to detect possible intrusion in AWS environments. We automatically recommend, deploy and monitor cloud-native decoys to provide high confidence security alerts. The question that naturally arises is: how long does it take to detect an event when it occurs?
Our systems process events within seconds of them being delivered by CloudTrail, but the largest component of the delay is how long it takes CloudTrail to deliver events to S3. There are a number of alternative methods of receiving events from CloudTrail (EventBridge, CloudWatch logs etc) but I'm particularly interested in S3 as the method we use ourselves and probably the default most people will reach for.
What does AWS say?
Historically, the delay has been quoted at 15 minutes but in March 2023, AWS updated their documentation to read:
CloudTrail publishes log files multiple times an hour, about every 5 minutes. CloudTrail typically delivers logs within an average of about 5 minutes of an API call. This time is not guaranteed.
As there is no SLA offered around this delay, I wanted to investigate the typical delay myself.
What did we find?
I found that the AWS guidance is accurate – but digging into the data reveals some interesting discoveries and allows for some fun speculation about AWS internals!
A quick primer on CloudTrail S3 delivery
CloudTrail delivers files to S3 using something like the following key structure:
AWSLogs/AccountID/CloudTrail/Region/YYYY/MM/DD/
    AccountID_CloudTrail_Region_YYYYMMDDTHHmmZ_UniqueString.json.gz
Each object is a compressed json file containing many CloudTrail events which occurred in the account and region. As each event contains a timestamp, we can compare those times to the S3 object's modification time to measure the delay.
Methodology
In my investigation, I used the data from Tracebit's organizational CloudTrail. All the data relates to our own activity in our own AWS accounts, and no customer data was analyzed. Different workloads might exhibit quite different results to those shown here - I'm very interested to hear if you run these queries against your own data!
Enter Athena
AWS Athena is a very useful tool for querying CloudTrail. I've created an Athena table for all our CloudTrail data which allows us to query all CloudTrail events in S3 using SQL. As well as the properties of the events themselves, Athena exposes certain metadata values about the underlying S3 files which come in very handy. These don't seem to be documented in AWS but some of the documentation for the underlying Trino query language gives us a clue about what to try. For our purposes, there are a couple of particularly interesting columns:
$path- this corresponds to the S3 key in which the event was found$file_modified_time- this corresponds to the last modified time of that S3 key
This means we can calculate the delay of CloudTrail events directly using Athena by querying e.g:
select
    "$file_modified_time"
        - parse_datetime("eventtime", 'YYYY-MM-dd''T''HH:mm:ssZ')
        as s3_write_delay_interval
from
    "cloudtrail_all_accounts"
limit 1;
The delay of individual events is interesting but I wanted to get a sense of the overall distribution of CloudTrail event delays. Trino comes with a wide variety of aggregate functions which can be used to calculate statistics so we don't need to resort to attempting to process individual events ourselves. For instance:
- count() can be used with filtering to calculate the number of events with a delay greater than a particular value
- approx_percentile() can be used to establish e.g. the 95th percentile delay
- numeric_histogram() can automatically calculate the bins and counts suitable to draw a histogram of the data
Using these I was able to plot a distribution of the delay over the last week for all our accounts:
A graph is worth a thousand words
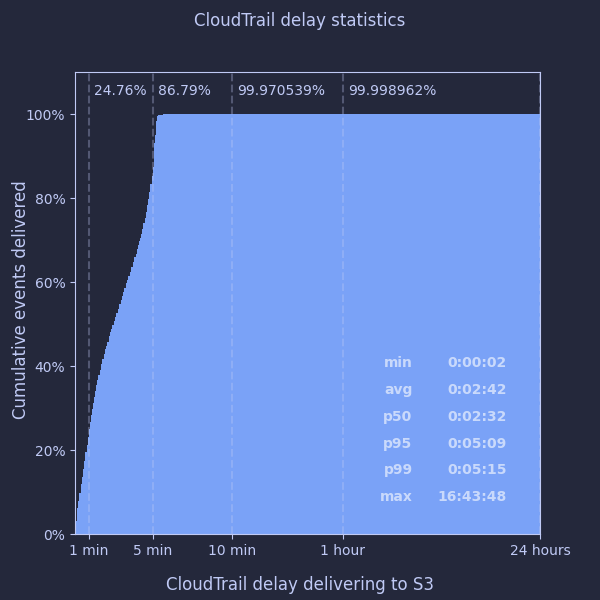
What does this tell us?
- the "5 minutes" average CloudTrail delay quoted by AWS appears accurate and quite conservative - the 99th percentile was just over 5 minutes
- the average CloudTrail delay appears to be considerably lower - around 2½ minutes
- fewer than 1 in 3000 events take longer than 10 minutes to be delivered
- … but the maximum delay can be really quite large, over 16 hours in this case
I had a look at the individual events which took several hours to arrive, but couldn't identify anything particular about the events themselves which may have caused this.
Going down the rabbit hole - do different AWS services have different delays?
I've previously noticed that CloudTrail seems to deliver events from different AWS services at slightly different times. I split out the data by AWS service to see if there was any truth to my perception.
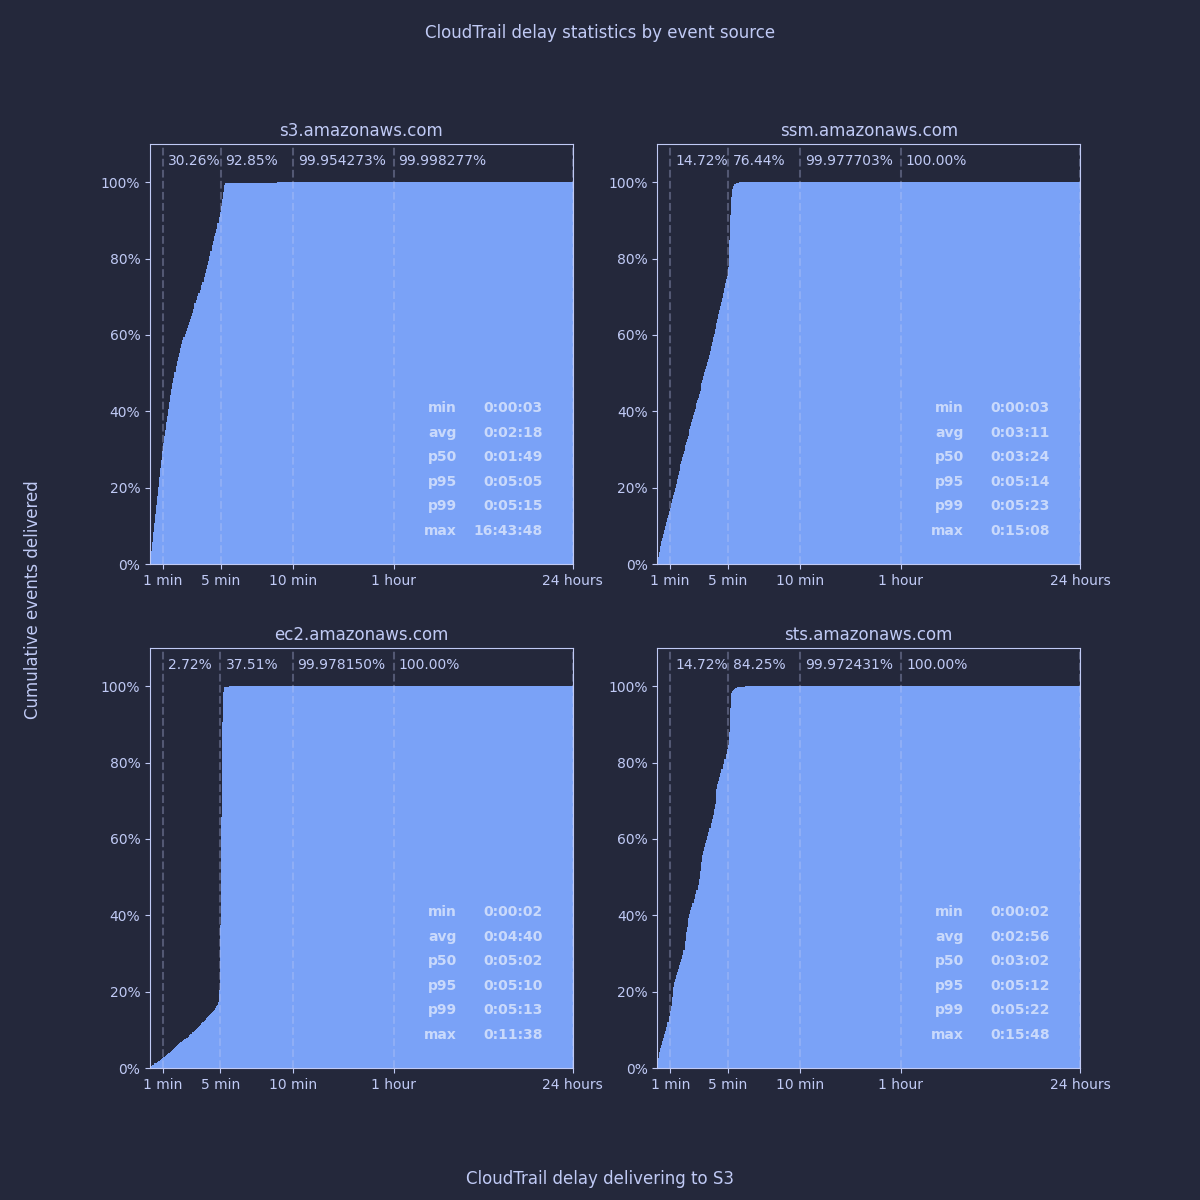
It's clear that the vast majority of events will be delivered within slightly more than 5 minutes, regardless of the underlying service. If I compare the average delay for S3 to EC2 however, it appears that there is a significant difference - EC2 events take twice as long on average to reach us. To make sure I was on the right track, I wanted to check some specific API call types from these services to see how they compare:
AssumeRole (sts.amazonaws.com)DescribeNetworkInterfaces (ec2.amazonaws.com)GetObject (s3.amazonaws.com)PutObject (s3.amazonaws.com)

These seem very consistent with the underlying services. I was intrigued by the slight difference between GetObject and PutObject; and the pattern that appears visible in AssumeRole events. To investigate further, I sampled 10k individual events of each type and plotted their delay relative to when the event occurred. In fact, as 5 minutes seems like such an important time period in CloudTrail, I plotted the event time modulo 5 minutes to try to establish if there was any periodic behavior:
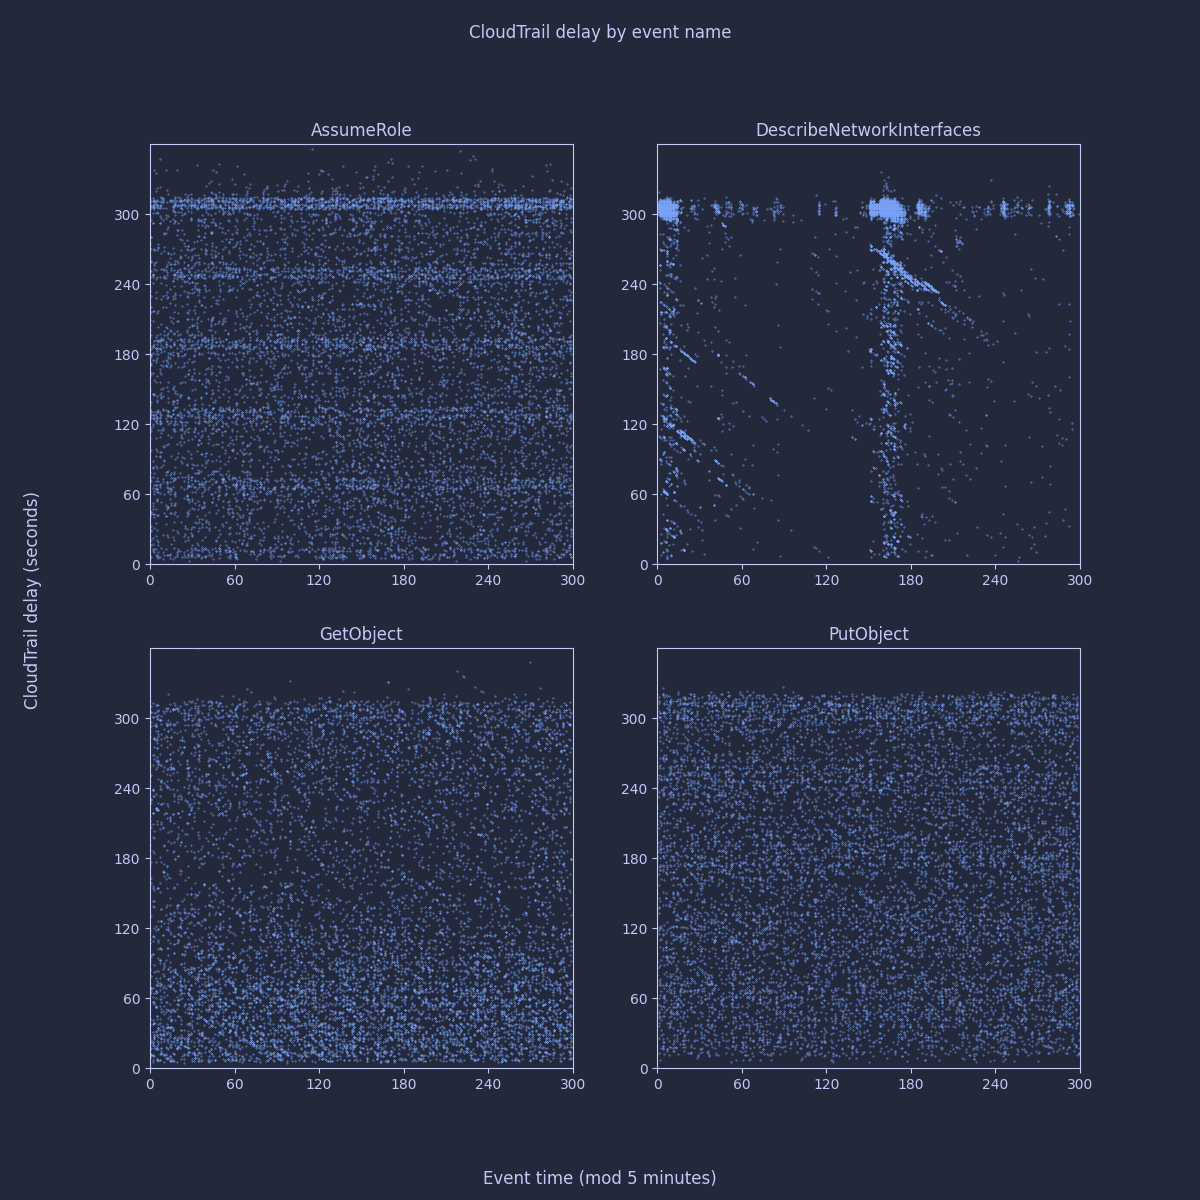
The differences here appear at first quite interesting - you can clearly see horizontal bands aligned with each minute for AssumeRole; slightly less clearly for PutObject. GetObject and DescribeNetworkInterfaces seem to show diagonal banding. I started to get quite excited about the possibility of different delivery mechanisms being used by the underlying services.
Signal vs Noise
On reflection, any given system's use of various AWS APIs are going to be far from independent variables. For instance, an application might always follow a PutObject request with a GetObject request, it might call DescribeNetworkInterfaces periodically every two minutes; or it might just use certain APIs a lot more than others. Tracebit is certainly no exception here, so without data from many more CloudTrail users I think most of these patterns are just artifacts of our own particular use of AWS.
In fact we use STS and S3 a lot more heavily in most accounts than we use EC2 (in terms of volume of events), so perhaps the apparently better behavior of S3 and STS is just due to that fact. Maybe what really makes a difference is the volume - or rather frequency - of events. Although we have an organizational CloudTrail, it's still ultimately a regional service for each account, so maybe comparing different regions will allow us to discern the signal from the noise.
Coming up for air - comparing busy regions to quiet ones
Going back to basics, I compared the delays for STS in our busiest account in its busiest region against the same account in its quietest region. The results are quite telling:

The average for our busiest region is 2 minutes 44 seconds. Delays are quite linear up to the 5 minute mark, after which nearly everything is delivered. In a region with very little activity however, nearly everything takes exactly five minutes.
Making sense of it all - a mental model for how CloudTrail works
On this basis (and unfortunately not being privy to any internal details!) I think a reasonable mental model for how CloudTrail works is something like:
- an event is received for a particular region in a particular account
- it allocates a buffer for storing events, and starts a five minute timer
- any events received in the meantime go into that buffer
- after the five minute timer elapses; it writes the buffer as json, compresses it, calculates the digest and uploads it to S3 (note that p95 delay is always a few seconds more than five minutes)
In reality it's definitely a lot more complicated than that as some events experience large delays and busy accounts/regions will receive more than one file per 5 minute period (there's a 50MB limit on each file). It seems like a reasonable simplification though.
To test this model, I sampled 1000 events from each of our accounts/regions and compared each event's delay in being written to S3 to how long that event occurred after the first event which was delivered in the same file. The $path metadata column and first_value() window function were invaluable in allowing me to ask a question like this of Athena! Here are the results:
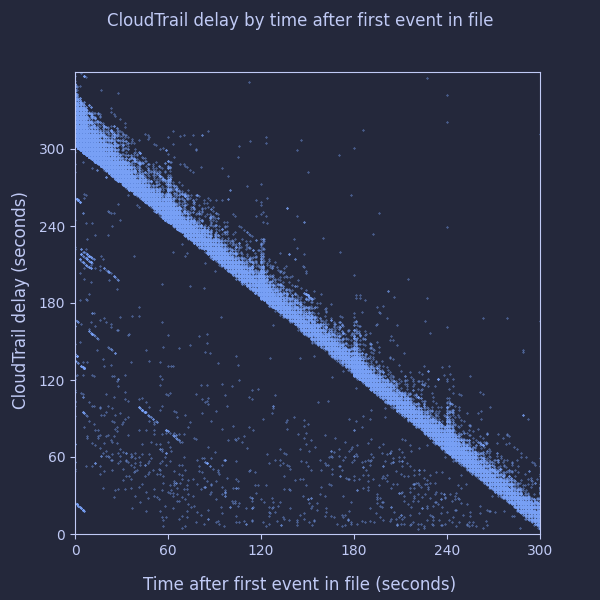
That strongly matches what I'd expect to see!
Future work
I think there are many interesting possibilities for future research. To give just one example: on the basis of the data I've seen, if I wanted to perform an API call and maximize the duration for which it went undetected, I'd probably try to perform it in an infrequently used region (assuming it's not disabled via SCP).
On the defensive side: is it possible to induce a noticeably lower average delay in inactive regions by creating a small but frequent level of background noise; say by calling GetCallerIdentity every 30 seconds or so?
Conclusion
In conclusion:
- you can expect nearly every event to be delivered by CloudTrail to S3 within slightly more than 5 minutes
- very rare exceptions could take hours
- in busy accounts/regions many events will take considerably less than 5 minutes
- Athena is an incredibly quick and useful tool for analyzing CloudTrail data - especially if you stray outside the AWS documentation
Acknowledgements
I'm particularly grateful to Rami McCarthy for his invaluable feedback on an early draft of this post.
Try it yourself
If you already have an athena table for your CloudTrail data, I've published a notebook on github containing all my queries and plotting code here. I'm very interested to hear about whatever you might discover!
